

高位引爆
這兩天很忙碌,除了陪家人吃喝玩樂這個重要節目之外,關於投資方面的還做了三件。
1,在亞K的網誌見到有個非常好用的免費英文Excel檔案,可以用來計算股票期權的預期盈虧、對沖值和時間值等數據,一時技癢,盡快修改了一個香港版本,用來計算國壽、中移動、神華、中海油等等的期權金和最佳行使價便更有把握。
2,安裝新的SONY EB17 電腦,以及一大堆TQ、MetaStock、Sharp Point、Office、PhotoShop、Wuala等軟件,花費不少精力。揾食工具當然要用心調較得順手合意。
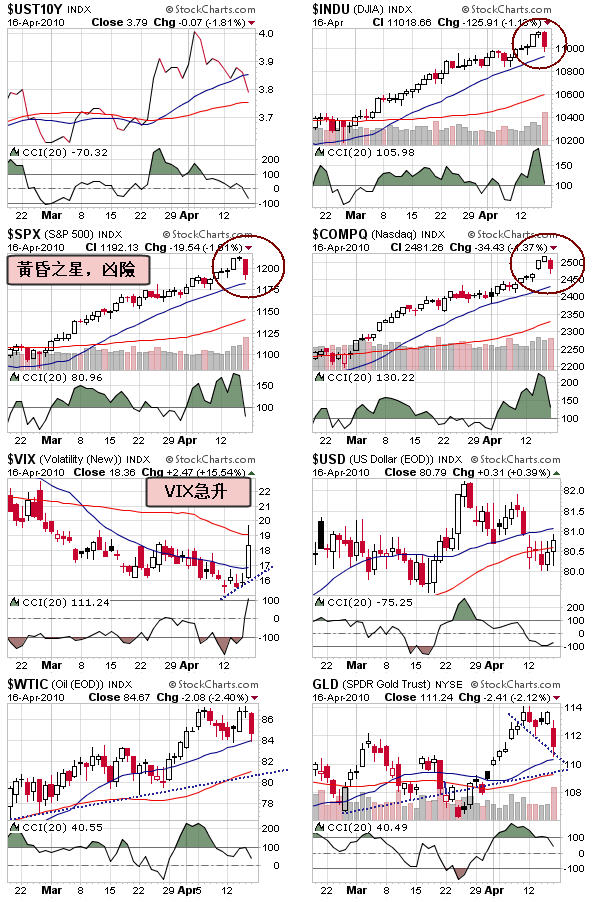
3,跟進高盛這「黑天鵝」事件的發展。華爾街繼投資大行高盛被美國證交會指控涉嫌詐騙後,另一投資大行美林(Merrill Lynch)亦被荷蘭一間銀行指涉及類似詐騙行為,令該銀行損失4500萬美元(約3.5億港元)。兩大行涉及欺詐行為的消息震動整個華爾街,這兩個指控可能只是冰山一角,用陰謀論估計,調查大行這些消息大戶不會毫無警覺,美股一路不尋常用挾上,大戶高位出貨和LONG PUT的機會很高。不斷挾高就是等待在高位引爆。跌市不能心急撈底,暫時觀察明天在21400是否有支持。4月可能還會挾高結算,如不能守在21670樓上,5月恐怕會有較深的調整。
股票期權速覽。 http://www.editgrid.com/user/jincao/CycleOption-Stock 金曹 jin.cao@hotmail.com.. http://blogcity.hkheadline.com/jincao 免責聲明/Disclaimer:本網誌宗旨是讓小投資者能夠互相支持,增加財經知識和改善投資心理素質,以期早日達到財務自由。本網誌一切言論純粹是個人意見或經驗分享,絕不應被視為投資建議,也不構成要約、招攬、邀請、誘使、建議或推薦任何投資產品。本人亦不保證所引述的資料的真確性和完整性。股價可升可跌,投資證券或衍生工具附有重大風險,讀者務請運用獨立思考能力自行分析和驗證。一切的投資決定以及該投資決定引致的收益或損失,概與本人無涉。
金曹回覆raytam,
我每日都貼免費公益軟件「港交所股票期權速覽」,裡面有很多最基本的數據、亦可以找到歷史波幅那一欄。市場做的引伸波幅可能更高,每日收市後在港交所找到。股票期權實用網站有整所有網站連結。
股票期權速覽。
http://www.editgrid.com/user/jincao/CycleOption-Stock
股票期權實用網站。
http://www.cycleoption.com.hk/page07.htm
Good morning Brother Kam: ^^
Thanks for your advice.
Thanks!
Kam hing, I used the Excel worksheet before and just like you to modified it to fit the stock option. However,do you know where to find the historical volatility ?
Furthermore, do you know how to combine the due month and next month data into one sheet ? as you know , the profile may contain the due month or next month option. In some case, even include the quarter month.
thanks your help in advance
史哥,Metastock顯示短期恆指支持21135、阻力22664。我估4月大戶會托一托市,營造樂觀氣氛,散戶只能見步行步,切忌心急撈底。
Good Evening Brother Kam: ^^
For your reference:
From the below daily graph-HSI, everyone can see that the HSI started a rally again after passing through the SMA(120)

 . The SMA(120)

 is around a '21456' now. That means the index will turn to weak again if it can not stand on '21456' after 3:45pm next Monday. If so the final supporting point will be around '21200' Which is the lower point of the upper line. Besides, there is a head-shoulder-top showing on the below graph also. By measurement the target will be '21800' - '600'('22400'- '21800')= 21200 also.
In addition, the HSI had always a '1200' to '1600' points of adjustment. For '1200' points of return is equal to ' 21200' also.
By referring to the next graph, everyone can see that, the HSI turn to strong again after standing on the lblue ine DMA again. The line is around a '21200' also now.
By taking all the above factors into account, the '21200' is the main critial point for the HSI.
P.S As the HSI had always a '1600' points of adjustment only before, that means the '20800'('22400'-1600) will be the final traget for the HSI.
P.s For a healthly adjustment, the HSI should not break through the average line SMA(10) showing on the weekly graph again. The SMA(10) is around a '21080'.
恒指在四月份將會以 21080 為中軸, 上下1300點波動, 現時走勢向上
19840- 20455- ( 21080) -21712- 22363
P.s Brother Kam.
Have you any comments ?
Thanks!