

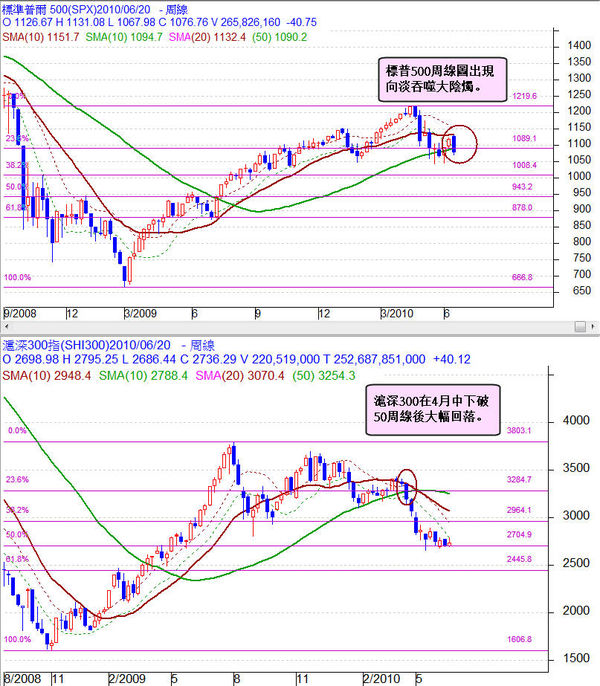
標普500大盤向淡吞噬
6月25日歐洲股市繼續回落,美股超賣反彈但大盤標普500指數的20天線再次失守,收1076,周線圖更出現向淡吞噬大陰燭,一周內連續下破20周線1132及50周線1090兩個重要支持位,走勢差。十年美債息跌至接近3厘,表示資金泊在美債避險。
滬深300在4月中周線圖出現大陰燭破50周線後,要經歷兩個月才見低位支持,照時間推算,美股在8月中有機會見到低位支持。由於美股走勢將會影響全球股市,現時仍維持逢高減持高PE及不派息的股份,增持現金等農行上市後出現調整買入或short put防守力較強的建行、工行、國壽等。支持位或short put接貨的行使價可參考每周的恆指及權重權及海龜N值報表(網誌分類:四叔五寶)。

香港股票期權速覽
http://www.editgrid.com/user/JinCao/CycleOption-Stock
免費公益軟件:香港股票期權組合管理stock option freeware下載區
http://www.wuala.com/JinCao/CycleOption-Stock
恆生指數HSI Index 每月收市價、市盈率 PE、股息率 Yield。
http://www.editgrid.com/user/jincao/HSI
金曹 jin.cao@hotmail.com..
http://blogcity.hkheadline.com/jincao
免責聲明/Disclaimer:本網誌宗旨是讓小投資者能夠互相支持,增加財經知識和改善投資心理素質,以期早日達到財務自由。本網誌一切言論純粹是個人意見或經驗分享,絕不應被視為投資建議,也不構成要約、招攬、邀請、誘使、建議或推薦任何投資產品。本人亦不保證所引述的資料的真確性和完整性。股價可升可跌,投資證券或衍生工具附有重大風險,讀者務請運用獨立思考能力自行分析和驗證。一切的投資決定以及該投資決定引致的收益或損失,概與本人無涉。
金師兄所言有理,謝謝意見。
Evening Brother Kam:
IcIc!
I think that the HSI is just a sthort term rebounding also.
Thanks!
金兄及各位大家好:
金曹回覆網友,
有網友問在那裡可以得到每天港股成交的資訊。可以參考我的網誌分類:「港交所實用資訊」。
路仁,大朋友托高指數才轉七月倉,我見到有點驚,如果7月做好倉應盡量在低位轉,無理由拉高來轉。
史哥,現時評估,美股就算反彈,也只是營造右肩,雖然未必出現雙底衰退大熊市,但有機會以較長的調整時間來抵消較深的跌幅。通常港股比較跟美股走勢,但A股對港股的影響力日漸增強。如美股反彈營造右肩,加上A股反彈,港股才有條件再上,相反,美股或A股再跌,港股難以上升。七月初估計恆指最多係反彈到熊證大倉位21500屠殺熊仔,之後仍是偏淡。ADX(9)始終是滯後指標,用來評估大行情的升跌變化的反應不夠敏銳。MACD看趨勢是比較準,港股MACD線沒有走出一浪高於一浪的形態,屬升有限的格局。最近美州政府及中國地方債的還款能力又被市場提及,空穴來風未必無因,如美國加洲出現信貸危險,對股市的殺傷力會比希臘大得多,中國國債及地方債相對GDP並不多、相對容易應付、但內銀股因農行上市被托高、又會捱沽。
http://www.bloomberg.com/news/2010-06-25/states-of-crisis-widen-as-46-governments-in-u-s-face-greek-style-deficits.html
史哥 27/6/2010 0:05:05


史哥 27/6/2010 0:01:11


史哥 26/6/2010 21:20:40


史哥 26/6/2010 23:49:37


Evening Brother Kam: ^^
Brother dai dai-
Evening Brother dai dai: ^^
道指周線圖
1)平均線出現「死亡谷」利淡訊號﹔
2)陰陽燭出現「傾盆大雨」利淡訊號﹔
相信下周都是跌市。?
Sorry!
However, I found that the line SMA(50) showing on the weekly graph is in a upward direction now. It closed just a little bit lower than that of the the line SMA(50) only.
Besides, I had also found that the signal ADX(9) showing on the daily graph is at a lower lelvel ( 波幅. is very small now) that means it will give a new trend soon.) I think that it will start a new trend on the starting of july. Moreover, I also found that most of the bear for Dow's is in a relative high level also.
By taking all the above factors into account that I think the '10100' can give a strong support for Dow's and the Dow's will start a rally soon
From the below daily graph, you can see that it will give a new trend when the signal ADX(9) turn to narrow with both of the signals MACD & %K%D had a cross over.
The signal ADX(9) had already turned to narrow now with both of the Signal MACD and %K%D wil try to cross over soon. That means the Dow's will give a new trend soon .
Brother dai dai:
From the below graph, you can see that the signal ADX(9) had alredy cross over. Besides, the siganl MACD had already given a diverge signal also. As the ADX(9) had already sticked together again that means it will give a new trend soon. I think that the trend is up as the signal MACD will stand on '0' point soon also.
P.s I had also found that the sp500 showing on the daily graph, had the same situation now also.
What do you think so?
金 sir 及各位早晨!